Creating tables
Often in gender economics we want to create complex three-way tables. Excel's Pivottable feature is a nice way to do that with data. A good place for help on how to create a complex table is available through Microsoft.
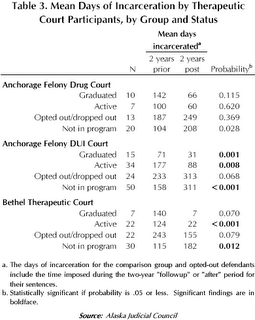
What does a three way crosstab look like? An example is to the right. Notice that there are three categories making up rows and columns. Cat 1: colums are prior or post
Cat2: row - which jurisdiction - Achorage, Bethel
Cat 3: row - what status of inmate- graduated, active
What does the table say? Mean days incarcerated lower if graduated from program. Higher if dropped out. Does this establish causality? No.
No comments:
Post a Comment