Tuesday, April 28, 2009

Question on regression

Hi Professor,
On the made up regression study page, how would you interpret the coefficients of the table explaining sex ratios in China? Also why would you take the natural log or square an independent variable in a regression analysis?
A Student

Either ln or sq. would be ways to turn what is a non-linear relationship into something that can be estimated as a linear relationship. So a parabola can be expressed as
y = a + bx + cx^2 for example.
Explaining sex ratios in China- the coefficient estimated for "distance to town" says that the farther from town the higher the male-female ratio (i.e. more men relative to women in the countryside). The Pop ethnic Chines says that Ethnic Chinese have higher ratio of men to women compared with non-Chinese ethnic groups.
Does that help?


Friday, April 24, 2009

Michael Ross and women's status in Middle East

Use this posting to start commenting on the reading by Michael Ross. Try to stick to his methods and arguments, and not your own pet theory, except insofar as you bring to bear evidence related to that presented by Ross.

Thursday, April 23, 2009

Stephan Klasen is professor of development economics and ...


Stephan Klasen is professor of development economics and empirical economic research at the University of Göttingen, where he also heads the Ibero-American Institute. Previously he was professor of economics at the University of Munich as well as a fellow at King's College in Cambridge and an economist at the World Bank in South Africa. His research interests are in population, labor, welfare, and development economics. He holds a BA, MA, and Ph.D. from Harvard University. His current research interests include an assessment of the relation between labor market events and demographic decisions at the household level, an analysis of the determinants of undernutrition and child mortality in developing countries, the linkages between inequality, growth, and well-being, and the causes and consequences of gender inequality in developing countries.

His papers are available here.

Tuesday, April 21, 2009

Why/when did women get right to vote in U.S. States...

Regression analysis results, in the New York Times...
Minority Rules: Sex Ratios and Suffrage
By Catherine Rampell

The Empire State was the home of the Seneca Falls Convention. Yet New Yorkers lagged far behind residents of Wyoming, Utah, Colorado, Arizona, California, Idaho, Montana and Nevada in actually granting women the full right to vote. As did all of New York’s fellow time-zone occupants.

So why did Western states and territories extend suffrage to women much earlier than their Eastern counterparts did? The answer, two economists say, might have something to do with sex ratios.

The fact that population proportions played a role probably isn’t surprising. One would expect states with a higher percentage of women to be more likely to enfranchise their female residents than states with a lower percentage of women. After all, there is power in numbers. Just ask Lysistrata.

But actually, the reverse was true. The jurisdictions that granted women the right to vote earlier generally had lower concentrations of women, a new study finds. (Some other factors that correlated with earlier adoption of women’s suffrage were: higher female employment levels; the share of Mormons in a jurisdiction; lower percentage of nonwhites; lower percentage of Irish-born Americans; and a smaller manufacturing sector.)

Read more...
Hat tip: Eric Ni

Monday, April 20, 2009

CEDAW is coming up

And there is an amazing set of postings on the topic at Opinio Juris, the top-notch law blog. you have to deovte 2-3 hours of reading to capture the full nuance. Read the postings here (start at the bottom, not with the most recent).

Saturday, April 18, 2009


Creating tables

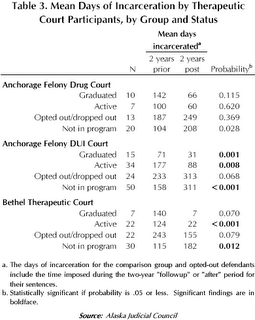
Often in gender economics we want to create complex three-way tables. Excel's Pivottable feature is a nice way to do that with data. A good place for help on how to create a complex table is available through Microsoft.

What does a three way crosstab look like? An example is to the right. Notice that there are three categories making up rows and columns. Cat 1: colums are prior or post
Cat2: row - which jurisdiction - Achorage, Bethel
Cat 3: row - what status of inmate- graduated, active

What does the table say? Mean days incarcerated lower if graduated from program. Higher if dropped out. Does this establish causality? No.

Wednesday, April 15, 2009

Comment on Uwem Akpan

I posted my comments here. I would be very happy if some of you discussed the stories in the comments section to this posting. I'm curious to know what you thought of the stories. I believe they and films like Monday's Girl offer a very strong "grounding" in the kinds of environments that we are talking about. Real people (even if fictional characters) are the ones we "observe" and "interpret" when we do data analysis.

Tuesday, April 14, 2009

Blog section for Monday's Girls


Hey all,
Here's the place to post your comments.

Friday, April 10, 2009

This one is so nerdy I love it... the bionic turtle!

Internet explodes with videos explaining regression

Last year there were literally no videos explaining regressions. now there are dozens. here's a nice one by an economist type... he may be a political scientist.

Some other dude's expanation of regression

I like his pointer and flipchart.

First short video on regression

Thursday, April 09, 2009

For what it is worth- t-test and comparing two means

Trends in Indonesia


The Human Development Index (GDP, mortality, education) continued climbing rapidly. For details see here.

Regression is hard, so get ready

One way to prepare yourself is by understanding correlation. An super-interesting blog discussion is taking place now in the field of "social neuroscience"...
"Voodoo Correlations" in fMRI - Whose voodoo?
It's the paper that needs little introduction - Ed Vul et. al.'s "Voodoo Correlations in Social Neuroscience". If you haven't already heard about it, read the Neurocritic's summary here or the summary at BPS research digest here. Ed Vul's personal page has some interesting further information here. (Probably the most extensive discussion so far, with a very comprehensive collection of links, is here.)
.....
The essence of the main argument is quite simple: if you take a set of numbers, then pick out some of the highest ones, and then take the average of the numbers you picked, the average will tend to be high. This should be no surprise, because you specifically picked out the high numbers. However, if for some reason you forgot or overlooked the fact that you had picked out the high numbers, you might think that your high average was an interesting discovery. This would be an error. We can call it the "non-independence error", as Vul et al. do.
Read more a the link above

Monday, April 06, 2009

What was Diane Wolf thinking about department...

I mentioned her allusions to debates in Marxist thought about the relationship between peasant production and capitalist production... here's an article current when Wolf was writing...

Capitalist Development and Subsistence Reproduction; Rural Women in India
Journal article by Maria Mies; Bulletin of Concerned Asian Scholars, Vol. 12, 1980

All economic systems, modes of production, and all hu­
man history presuppose two types of basic human activities:
production of the means of subsistence and production of new
life or procreation. The first is necessary to satisfy basic human
needs and to sustain life, the second to ensure the continuation
of society from generation to generation. Engels correctly called
both types of human activity production and stated that the
institutions of a particular society or of a particular epoch are
determined by the organization and the development of these
two types of production. 1 as production of the means of subsis­
tence is dependent on human cooperation in labor, so too pro­
duction of new life or procreation is dependent on the coopera­
tion of women and men in the sexual act. Both processes are
closely interlinked, and as Marx noted, in both processes people
enter into a double relationship.

The production of life, both of one's own in labour and of
fresh life in procreation, now appears as a double relation­
ship: on the one hand as a natural, on the other as a social
relationship. By social, we understand the cooperation of
several individuals no matter under what conditions, in what
manner and to what end. It follows that a certain mode of
production, or industrial stage, is always combined with a
certain mode of cooperation, or social stage, and this mode
of cooperation is itself a productive force.2

Insofar as the production of human life and of living­
working capacity is the necessary precondition of all modes and
forms of production, we shall call this the subsistence produc­
tion and reproduction....


For me you need to look it up in the library! I can't find a copy online.

Thursday, April 02, 2009

Averages and percents

In response to a student query:
You want to average- remember that the average of a variable that is 0 or 1 is simply the percent that are 1 (i.e. the percent that are girls, if the variable is female). Remember that a number like .45 is the same as 45%, in this case.

Wednesday, April 01, 2009

Context for the Indonesia data, and small mistake in assignment 1

The data that you have for assignment 1 comes from the Indonesia Family life Survey (IFLS). The context of the data analysis is the following question:
If you were husband and wife and had a strong preference for sons, what would be possible observable patterns in your fertility behavior?
a) If you had a son, maybe you would wait longer to have another child
b) If you had a daughter, maybe you would hurry to have another child

a) If you had a son, maybe you would not have any further children (holding all the previous children you had constant)
b) If you had a daughter, maybe you would decide to have another child, and hope it was a son

So some of the implications of this "optimal fertility" behavior with son preference would be that the intervals to next children would depend on the gender of the previous child, the size of a family would be larger if a child was a girl, the last (youngest) child in a family would be more likely to be a son.

I noticed that I had a typo in the problem set- in the top I say decadeborn70 should be for decades 50,60,70 and the in the bottom part I wrote
decade born = 1 if 70,80 or 90

Since you are doing the data analysis, you can code it however you like, but make a note on your coding which decades are 0 and which are 1 in the new variable you create.

My apologies for any confusion.

Son preference in the U.S.?

Are there missing girls in the United States?
Evidence on gender preference and gender selection

by Jason Abrevaya
Full paper is here
September 2005
ABSTRACT
Gender selection, manifested by unusually high percentages of male births, has spread in parts of Asia since the introduction of ultrasound technology. This paper provides the first empirical evidence consistent with the occurrence of gender selection within the United States. Based upon fertility-stopping behavior, the aggregate gender preferences among different races in the United States are documented. Analysis of comprehensive birth data shows unusually high boy-birth percentages after 1980 among later children (most notably third and fourth children) born to Chinese and Asian Indian mothers. Moreover, Asian Indian mothers are found to be significantly more likely both to have a terminated pregnancy and to give birth to a son when they have previously only given birth to girls. These findings are consistent with a simple dynamic model of the gender-selection decision in the presence of gender preferences